Stop Loss with ExitsStandard Percentage-based Stop Loss for long and short, with configurable extra exit conditions.
Just copy/paste into your script.
Uses "low" and "high" values for crossing the stop loss threshold, but can be changed to "close" if you prefer (change "low" and "high" on lines 31 and 32 to "close")
Поиск скриптов по запросу "stop loss"
Stop Loss and TargetsEnter your purchase price, SL% and up to 3x TP%s. Automatically plots them on your chart to enable quicker set up of alerts.


Stop loss hunting killer [Eric] - Innovated by DennisLeeBTCMy AI algo can prevent you falling into stupid stop loss hunting:
When the volume is lime, means bulls already controlled the market, red for bears.
So when it already turned red, just short the pump, it can be a decent exit pump, when it's lime, long the dump.
It can also tell you the trending direction
**This indicator also works great in the Forex and Stock market.

$TUBR: Stop Loss IndicatorATR-Based Stop Loss Indicator for TradingView by The Ultimate Bull Run Community: TUBR
**Overview**
The ATR-Based Stop Loss Indicator is a custom tool designed for traders using TradingView. It helps you determine optimal stop loss levels by leveraging the Average True Range (ATR), a popular measure of market volatility. By adapting to current market conditions, this indicator aims to minimize premature stop-outs and enhance your risk management strategy.
---
**Key Features**
- **Dynamic Stop Loss Levels**: Calculates stop loss prices based on the ATR, providing both long and short stop loss suggestions.
- **Customizable Parameters**: Adjust the ATR period, multiplier, and smoothing method to suit your trading style and the specific instrument you're trading.
- **Visual Aids**: Plots stop loss lines directly on your chart for easy visualization.
- **Alerts and Notifications** (Optional): Set up alerts to notify you when the price approaches or hits your stop loss levels.
---
**Understanding the Indicator**
1. **Average True Range (ATR)**:
- **What It Is**: ATR measures market volatility by calculating the average range between high and low prices over a specified period.
- **Why It's Useful**: A higher ATR indicates higher volatility, which can help you set stop losses that accommodate market fluctuations.
2. **ATR Multiplier**:
- **Purpose**: Determines how far your stop loss is placed from the current price based on the ATR.
- **Example**: An ATR multiplier of 1.5 means the stop loss is set at 1.5 times the ATR away from the current price.
3. **Smoothing Methods**:
- **Options**: Choose from RMA (default), SMA, EMA, WMA, or Hull MA.
- **Effect**: Different smoothing methods can make the ATR more responsive or smoother, affecting where the stop loss is placed.
---
**How the Indicator Works**
- **Long Stop Loss Calculation**:
- **Formula**: `Long Stop Loss = Close Price - (ATR * ATR Multiplier)`
- **Purpose**: For long positions, the stop loss is set below the current price to protect against downside risk.
- **Short Stop Loss Calculation**:
- **Formula**: `Short Stop Loss = Close Price + (ATR * ATR Multiplier)`
- **Purpose**: For short positions, the stop loss is set above the current price to protect against upside risk.
- **Plotting on the Chart**:
- **Green Line**: Represents the suggested stop loss level for long positions.
- **Red Line**: Represents the suggested stop loss level for short positions.
---
**How to Use the Indicator**
1. **Adding the Indicator to Your Chart**:
- **Step 1**: Copy the PineScript code of the indicator.
- **Step 2**: In TradingView, click on **Pine Editor** at the bottom of the platform.
- **Step 3**: Paste the code into the editor and click **Add to Chart**.
- **Step 4**: The indicator will appear on your chart with the default settings.
2. **Adjusting the Settings**:
- **ATR Period**:
- **Definition**: Number of periods over which the ATR is calculated.
- **Adjustment**: Increase for a smoother ATR; decrease for a more responsive ATR.
- **ATR Multiplier**:
- **Definition**: Factor by which the ATR is multiplied to set the stop loss distance.
- **Adjustment**: Increase to widen the stop loss (less likely to be hit); decrease to tighten the stop loss.
- **Smoothing Method**:
- **Options**: RMA, SMA, EMA, WMA, Hull MA.
- **Adjustment**: Experiment to see which method aligns best with your trading strategy.
- **Display Options**:
- **Show Long Stop Loss**: Toggle to display or hide the long stop loss line.
- **Show Short Stop Loss**: Toggle to display or hide the short stop loss line.
3. **Interpreting the Indicator**:
- **Long Positions**:
- **Action**: Set your stop loss at the value indicated by the green line when entering a long trade.
- **Short Positions**:
- **Action**: Set your stop loss at the value indicated by the red line when entering a short trade.
- **Adjusting Stop Losses**:
- **Trailing Stops**: You may choose to adjust your stop loss over time, moving it in the direction of your trade as the ATR-based stop loss levels change.
4. **Implementing in Your Trading Strategy**:
- **Risk Management**:
- **Position Sizing**: Use the stop loss distance to calculate your position size based on your risk tolerance.
- **Consistency**: Apply the same settings consistently to maintain discipline.
- **Combining with Other Indicators**:
- **Enhance Decision-Making**: Use in conjunction with trend indicators, support and resistance levels, or other technical analysis tools.
- **Alerts Setup** (If included in the code):
- **Purpose**: Receive notifications when the price approaches or hits your stop loss level.
- **Configuration**: Set up alerts in TradingView based on the alert conditions defined in the indicator.
---
**Benefits of Using This Indicator**
- **Adaptive Risk Management**: By accounting for current market volatility, the indicator helps prevent setting stop losses that are too tight or too wide.
- **Minimize Premature Stop-Outs**: Reduces the likelihood of being stopped out due to normal price fluctuations.
- **Flexibility**: Customizable settings allow you to tailor the indicator to different trading instruments and timeframes.
- **Visualization**: Clear visual representation of stop loss levels aids in quick decision-making.
---
**Things to Consider**
- **Market Conditions**:
- **High Volatility**: Be cautious as ATR values—and thus stop loss distances—can widen, increasing potential losses.
- **Low Volatility**: Tighter stop losses may increase the chance of being stopped out by minor price movements.
- **Backtesting and Optimization**:
- **Historical Analysis**: Test the indicator on past data to evaluate its effectiveness and adjust settings accordingly.
- **Continuous Improvement**: Regularly reassess and fine-tune the parameters to adapt to changing market conditions.
- **Risk Per Trade**:
- **Alignment with Risk Tolerance**: Ensure the stop loss level keeps potential losses within your acceptable risk per trade (e.g., 1-2% of your trading capital).
- **Emotional Discipline**:
- **Stick to Your Plan**: Avoid making impulsive changes to your stop loss levels based on emotions rather than analysis.
---
**Example Usage Scenario**
1. **Setting Up a Long Trade**:
- **Entry Price**: $100
- **ATR Value**: $2
- **ATR Multiplier**: 1.5
- **Calculated Stop Loss**: $100 - ($2 * 1.5) = $97
- **Action**: Place a stop loss order at $97.
2. **During the Trade**:
- **Price Increases to $105**
- **ATR Remains at $2**
- **New Stop Loss Level**: $105 - ($2 * 1.5) = $102
- **Action**: Move your stop loss up to $102 to lock in profits.
---
**Final Tips**
- **Documentation**: Keep a trading journal to record your trades, stop loss levels, and observations for future reference.
- **Education**: Continuously educate yourself on risk management and technical analysis to enhance your trading skills.
- **Support**: Engage with trading communities or seek professional advice if you're unsure about implementing the indicator effectively.
---
**Conclusion**
The ATR-Based Stop Loss Indicator is a valuable tool for traders looking to enhance their risk management by setting stop losses that adapt to market volatility. By integrating this indicator into your trading routine, you can improve your ability to protect capital and potentially increase profitability. Remember to use it as part of a comprehensive trading strategy, and always adhere to sound risk management principles.
---
**How to Access the Indicator**
To start using the ATR-Based Stop Loss Indicator, follow these steps:
1. **Obtain the Code**: Copy the PineScript code provided for the indicator.
2. **Create a New Indicator in TradingView**:
- Open TradingView and navigate to the **Pine Editor**.
- Paste the code into the editor.
- Click **Save** and give your indicator a name.
3. **Add to Chart**: Click **Add to Chart** to apply the indicator to your current chart.
4. **Customize Settings**: Adjust the input parameters to suit your preferences and start integrating the indicator into your trading strategy.
---
**Disclaimer**
Trading involves significant risk, and it's possible to lose all your capital. The ATR-Based Stop Loss Indicator is a tool to aid in decision-making but does not guarantee profits or prevent losses. Always conduct your own analysis and consider seeking advice from a financial professional before making trading decisions.

The Forex Stop Loss CalculatorNOTE: I am NOT a professional trader. I DO NOT provide investment advice. This content and the data provided in the indicator is based on my live and simulated, personal observations and is ONLY intended for educational purposes. YOU are responsible for ALL your trading decisions and ALL subsequent tax ramifications. Past performance DOES NOT guarantee future results.
“The Forex Stop Loss Calculator” ONLY displays numbers, NOT lines or a histogram etc. Why? It’s simple! All that other stuff is just clutter on your screen. By displaying ONLY numbers, you can tighten the vertical height of this indicator down to almost nothing. That saves precious real estate on your chart.
Here is what the 8 numbers displayed in “The Forex Stop Loss Calculator” can DO FOR YOU:
Buy/Long Position Stop Losses:
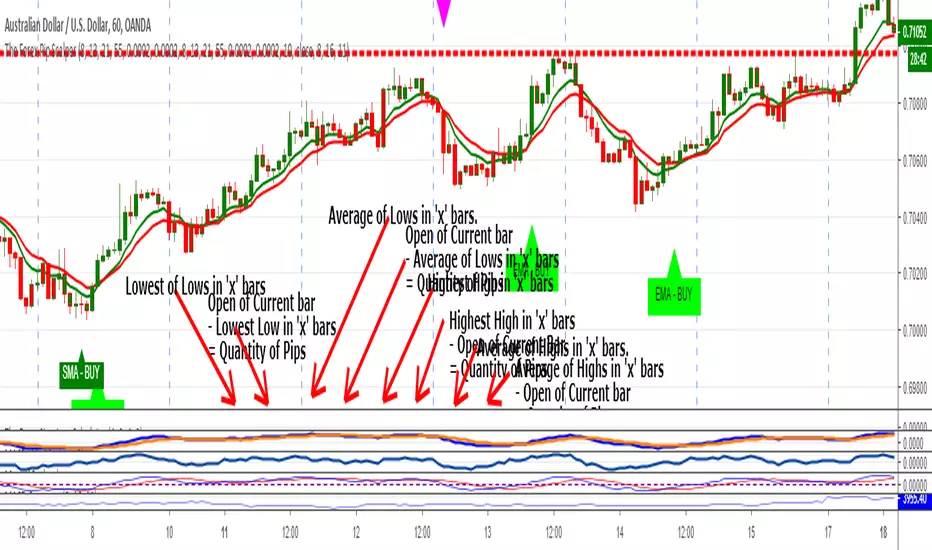
#1: This Green Number helps locate a potential Stop Loss PRICE LOCATION for your BUY position based on the LOWEST LOW within a variable number of bars back. You can set that variable quantity to any number of bars desired. This quantity IN cludes the Current Bar.
#2: This Green Number stops you from having to do any math. It subtracts the Price Location listed in the previous Green Number from the OPEN Price of the Current Bar and yields the Quantity of Pips you might risk between those two prices. Here is why that is important. Let’s say that you do not take trades that are above a certain pip/risk number. With “The Forex Stop Loss Calculator” you DO NOT have to bring up any extra tools or do any quick calculations. That’s all a waste of time. With this indicator you can determine at a glance if the current set up is within your personal trading rules. For example, if this listing was .00072 (with a PRECISION setting of 5 decimal points), that would indicate a Stop Loss of 7.2 pips. If that number is above your normal risk tolerance you move onto the next pair.
#3: This Blue Number provides a slightly DIFFERENT way to determine a Stop Loss for a BUY position. It displays the AVERAGE LOW Price Location within a variable number of bars back. You can set that variable quantity from 1-25 bars. This quantity EX cludes the Current Bar.
#4: This Blue Number stops you from having to do any math. It subtracts the AVERAGE Price Location listed in the previous Blue Number from the OPEN Price of the Current Bar and yields the Quantity of Pips you might risk between those two prices. For example, if this listing was .031 (with a PRECISION setting of 3 decimal points), that would indicate a Stop Loss of 3.1 pips. This obviously saves time as I mentioned in #2 above.
Sell/Short Position Stop Losses:
#5: This Red Number helps locate a potential Stop Loss PRICE LOCATION for your SELL position based on the HIGHEST HIGH within a variable number of bars back. You can set that variable quantity to any number of bars desired. This quantity IN cludes the Current Bar.
#6: This Red Number stops you from having to do any math. It subtracts the OPEN Price of the Current Bar from the Price Location listed in the previous Red Number and yields the Quantity of Pips you might risk between those two prices. For example, if this listing was .00065 (with a PRECISION setting of 5 decimal points), that would indicate a Stop Loss of 6.5 pips. Here again, this saves time as I mentioned in #2 above.
#7: This Blue Number provides a slightly DIFFERENT way to determine a Stop Loss for a SELL position. It displays the AVERAGE HIGH Price Location within a variable number of bars back. You can set that variable quantity from 1-25 bars. This quantity EX cludes the Current Bar.
#8: This Blue Number stops you from having to do any math. It subtracts the OPEN Price of the Current Bar from the AVERAGE Price Location listed in the previous Blue Number and yields the Quantity of Pips you might risk between those two prices. For example, if this listing was .088 (with a PRECISION setting of 3 decimal points), that would indicate a Stop Loss of 8.8 pips. As I mentioned in #2 above, this obviously save a lot of time.
IMPORTANT: Some Forex pairs are displayed with 3 decimal points. Others are displayed with 5 decimal points. The default setting for “The Forex Stop Loss Calculator” is 3 decimal points. However, that can be EASILY changed. Just click on the ‘SETTINGS/GEAR’ icon which is the second one to the right of the name of the indicator. At the BOTTOM of the ‘STYLE’ tab, change the ‘PRECISION’ setting back and forth from 3 to 5 as necessary. Hit ‘OK’ and you are good to go.
OR (if you left the Precision setting at 5) once you land on a chart, immediately make a quick mental note as to the decimal point quantity in the price scale of that chart. If it is a 3 decimal point pair, just disregard the LAST TWO numbers in the display of the indicator. In other words, a display of .08967 for a 3 decimal point pair would indicate a Stop Loss of 8.9 pips.
NOTE: If you install the indicator and the calculated numbers are not displayed, that’s an EASY fix. Simply RIGHT click on any white space in the chart. Near the bottom of the pop up screen, select ‘SETTINGS’. Next, select the ‘BACKGROUND’ tab. On that tab, locate ‘INDICATOR VALUES’ . Put a check in that box, click ‘OK’ and you’re done. The numbers defined by the indicator should now be displayed to the right of its name.
If you would like a Word Document version of this information, just private message me.
Full Speed ahead. Go get ‘em!!!
The Trading Guy
Value at Risk (VaR/CVaR) - Stop Loss ToolThis script calculates Value at Risk (VaR) and Conditional Value at Risk (CVaR) over a configurable T-bar forward horizon, based on historical T-bar log returns. It plots projected price thresholds that reflect the worst X% of historical return outcomes, helping set statistically grounded stop-loss levels.
A 95% 5-day VaR of −3% means: “In the worst 5% of all historical 5-day periods, losses were 3% or more.” If you're bullish, and your thesis is correct, price should not behave like one of those worst-case scenarios. So if the market starts trading below that 5-day VaR level, it may indicate that your long bias is invalidated, and a stop-loss near that level can help protect against further downside consistent with tail-risk behavior.
How it's different:
Unlike ATR or standard deviation-based methods, which measure recent volatility magnitude, VaR/CVaR incorporate both the magnitude and **likelihood** (5% chance for example) of adverse moves. This makes it better suited for risk-aware position sizing and exits grounded in actual historical return distributions.
How to use for stop placement:
- Set your holding horizon (T) and confidence level (e.g., 95%) in the inputs.
- The script plots a price level below which only the worst 5% (or chosen %) of T-bar returns have historically occurred (VaR).
- If price approaches or breaches the VaR line, your bullish/bearish thesis may be invalidated.
- CVaR gives a deeper threshold: the average loss **if** things go worse than VaR — useful for a secondary or emergency stop.
FURTHER NOTES FROM SOURCE CODE:
//======================================================================//
// If you're bullish (expecting the price to go up), then under normal circumstances, prices should not behave like they do on the worst-case days.
// If they are — you're probably wrong, or something unexpected is happening. Basically, returns shouldn't be exhibiting downside tail-like behavior if you're bullish.
// VaR(95%, T) gives the threshold below which the price falls only 5% of the time historically, over T days/bars and considering N historical samples.
// CVaR tells you the expected/average price level if that adverse move continues
// Caveats:
// For a variety of reasons, VaR underestimates volatility, despite using historical returns directly rather than making normality assumptions
// as is the case with the standard historicalvol/bollinger band/stdev/ATR approaches)
// Volatility begets volatility (volatility clustering), and VaR is not a conditional probability on recent volatility so it likely underestimates the true volatility of an adverse event
// Regieme shifts occur (bullish phase after prolonged bearish behavior), so upside/short VaR would underestimate the best-case days in the beginning of that move, depending on lookahead horizon/sampling period
// News/events happen, and maybe your sampling period doesn't contain enough event-driven returns to form reliable stats
// In general of course, this tool assumes past return distributions are reflective of forward risk (not the case in non-stationary time series)
// Thus, this tool is not predictive — it shows historical tail risk, not guaranteed outcomes.
// Also, when forming log-returns, overlapping windows of returns are used (to get more samples), but this introduces autocorrelation (if it wasn't there already). This means again, the true VaR is underestimated.
// Description:
// This script calculates and plots both Value at Risk (VaR) and
// Conditional Value at Risk (CVaR) for a given confidence level, using
// historical log returns. It computes both long-side (left tail) and
// short-side (right tail) risk, and converts them into price thresholds (red and green lines respectively).
//
// Key Concepts:
// - VaR: "There is a 95% chance the loss will be less than this value over T days. Represents the 95th-percentile worst empirical returns observed in the sampling period, over T bars.
// - CVaR: "Given that the loss exceeds the VaR, the average of those worst 5% losses is this value. (blue line)" Expected tail loss. If the worst case breached, how bad can it get on average
// - For shorts, the script computes the mirror (right-tail) equivalents.
// - Use T-day log returns if estimating risk over multiple days forward.
// - You can see instances where the VaR for time T, was surpassed historically with the "backtest" boolean
//
// Usage for Stop-Loss:
// - LONG POSITIONS:
// • 95th percentile means, 5% of the time (1 in 20 times) you'd expect to get a VaR level loss (touch the red line), over the next T bars.
// • VaR threshold = minimum price expected with (1 – confidence)% chance.
// • CVaR threshold = expected price if that worst-case zone is breached.
// → Use as potential stop-loss (VaR) or disaster stop (CVaR). If you're bullish (and you're right), price should not be exhibiting returns consistent with the worst 5% of days/T_bars historically.
//======================================================================//

Relativity Adaptive Stop-LossRelativity Adaptive Stop-Loss is a stop-loss technique that uses the Relativity Autonomous Distribution Blocks algorithm.
For detailed info about Relativity Autonomous Distribution Blocks :
*** Features
This structure is different from standard stop-losses.
The base frame is based on "Market Adaptive Stop-Loss" script.
For detailed information about Market Adaptive Stop-Loss:
This script uses the Relativity Autonomous Distribution Blocks as cross method.
Tradeable / Non Tradeable Region Detector :
This script separates tradeable and non-tradeable regions with a coloring method.
Plotting Rules :
* Maroon : Uncorfirmed Short Positions
* Teal : Unconfirmed Long Positions
* Green : Confirmed Long Positions
* Red : Confirmed Short Positions
This script can be used in only 1W time frame. (TF = 1W )
Does not repaint on 1W and larger time frames. ( Source = close )
*** Settings :
The only option here is the ATR multiplier.
The default use value of this ATR multiplier, which is of the standard of stop-loss, is 2.You can set it from the menu.
No alert is set.
Because the positive and negative regions are the same as Relativity Autonomous Distribution Blocks.
Since the traders can trade according to the support and resistance outside the definite regions, the unnecessary signal was confused and the alerts were removed.
*** USAGE
The Stop-Loss indicator can slide on the chart.
So you have to make sure you put it in right place.
Using this script in a new pane below will radically solve slip problems.
Stop-Loss values do not slip definitely.The values can select from the alignment.
NOTE :
Some structures (Market Adaptive Stop-Loss) and design in this script are inspired by everget's Chandelier Exit script :
Best regards.
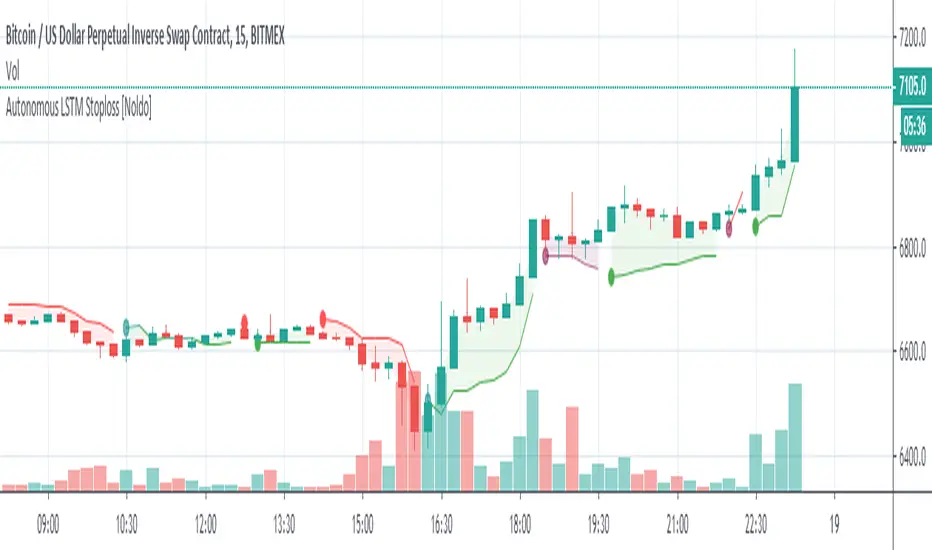
Autonomous LSTM Stop-LossStructure
Autonomous LSTM Stop-Loss is a stop-loss technique that uses the Autonomous LSTM algorithm.
For detailed info about Autonomous LSTM :
*** Features
This structure is different from standard stop-losses.
The base frame is based on "Market Adaptive Stop-Loss" script.
For detailed information about Market Adaptive Stop-Loss:
This script uses the Autonomous LSTM as cross method.
Tradeable / Non Tradeable Region Detector :
This script separates tradeable and non-tradeable regions with a coloring method.
Plotting Rules :
* Maroon : Uncorfirmed Short Positions
* Teal : Unconfirmed Long Positions
* Green : Confirmed Long Positions
* Red : Confirmed Short Positions
This script can be used in all time frames.
Does not repaint. ( Source = close )
*** Settings :
The only option here is the ATR multiplier.
The default use value of this ATR multiplier, which is of the standard of stop-loss, is 2.You can set it from the menu.
No alert is set.
Because the positive and negative regions are the same as Autonomous LSTM.
Since the traders can trade according to the support and resistance outside the definite regions, the unnecessary signal was confused and the alerts were removed.
*** Usage
The Stop-Loss indicator can slide on the chart.
So you have to make sure you put it in place.
Since this is a region scan from the OHLC levels, indicator contains small blue dots to the ohlc levels and made it serve as a guide.
However, since we cannot know the OHLC values precisely, it is best to use them as follows:
Because it is often forgotten to put it in place:
(OHLC : Average of Open, High, Low, and Closing prices for each period)
Using this script in a new pane below will radically solve slip problems.
Stop-Loss values do not slip definitely.The values are selected from the alignment.
NOTE :
Some structures (Market Adaptive Stop-Loss) and design in this script are inspired by everget's Chandelier Exit script :
Best regards.
Trailing Stop Loss [TradingFinder] 4 Machine Learning Methods🔵 Introduction
The trailing stop indicator dynamically adjusts stop-loss (SL) levels to lock in profits as price moves favorably. It uses pivot levels and ATR to set optimal SL points, balancing risk and reward.
Trade confirmation filters, a key feature, ensure entries align with market conditions, reducing false signals. In 2023 a study showed filtered entries improve win rates by 15% in forex. This enhances trade precision.
SL settings, ranging from very tight to very wide, adapt to volatility via ATR calculations. These settings anchor SL to previous pivot levels, ensuring alignment with market structure. This caters to diverse trading styles, from scalping to swing trading.
The indicator colors the profit zone between the entry point (EP) and SL, using light green for buy trades and light red for sell trades. This visual cue highlights profit potential. It’s ideal for traders seeking dynamic risk management.
A table displays real-time trade details, including EP, SL, and profit/loss (PNL). Backtests show trailing stops cut losses by 20% in trending markets. This transparency aids decision-making.
🔵 How to Use
🟣 SL Levels
The trailing stop indicator sets SL based on pivot levels and ATR, offering four options: very tight, tight, wide, or very wide. Very tight SLs suit scalpers, while wide SLs fit swing traders. Select the base level to match your strategy.
If price hits the SL, the trade closes, and the indicator evaluates the next trade using the selected filter. This ensures disciplined trade management. The cycle restarts with a new confirmed entry.
Very tight SLs, set near recent pivots, trigger exits early to minimize risk but limit profits in volatile markets. Wide SLs, shown as farther lines, allow more price movement but increase exposure to losses. Adjust based on ATR and conditions, noting SL breaches open new positions.
🟣 Visualization
The indicator’s visual cues, like colored profit zones, simplify monitoring, with light green showing the profit area from EP to trailed SL. Dashed lines mark entry points, while solid lines track the trailed SL, triggering new positions when breached.
When price moves into profit, the area between EP and SL is colored—light green for longs, light red for shorts. This highlights the profit zone visually. The SL trails price, locking in gains as the trade progresses.
🟣 Filters
Upon trade entry, the indicator requires confirmation via filters like SMA 2x or ADX to validate momentum. Filters reduce false entries, though no guarantee exists for improved outcomes. Monitor price action post-entry for trade validity.
Filters like Momentum or ADX assess trend strength before entry. For example, ADX above 25 confirms strong trends. Choose “none” for unfiltered entries.
🟣 Bullish Alert
For a bullish trade, the indicator opens a long position with a green SL Line (after optional filters), trailing the SL below price. Set alerts to On in the settings for notifications, or Off to monitor manually.
🟣 Bearish Alert
In a bearish trade, the indicator opens a short position with a red SL Line post-confirmation, trailing the SL above price. With alerts On in the settings, it notifies the potential reversal.
🟣 Panel
A table displays all trades’ details, including Win Rates, PNL, and trade status. This real-time data aids in tracking performance. Check the table to assess trade outcomes instantly.
Review the table regularly to evaluate trade performance and adjust settings. Consistent monitoring ensures alignment with market dynamics. This maximizes the indicator’s effectiveness.
🔵 Settings
Length (Default: 10) : Sets the pivot period for calculating SL levels, balancing sensitivity and reliability.
Base Level : Options (“Very tight,” “Tight,” “Wide,” “Very wide”) adjust SL distance via ATR.
Show EP Checkbox : Toggles visibility of the entry point on the chart.
Show PNL : Displays profit/loss data for active and closed trades.
Filter : Options (“none,” “SMA 2x,” “Momentum,” “ADX”) validate trade entries.
🔵 Conclusion
The trailing stop indicator, a dynamic risk management tool, adjusts SLs using pivot levels and ATR. Its confirmation filters reduce false entries, boosting precision. Backtests show 20% loss reduction in trending markets.
Customizable SL settings and visual profit zones enhance usability across trading styles. The real-time table provides clear trade insights, streamlining analysis. It’s ideal for forex, stocks, or crypto.
While filters like ADX improve entry accuracy, no setup guarantees success in all conditions. Contextual analysis, like trend strength, is key. This indicator empowers disciplined, data-driven trading.

Market Structure Based Stop LossMarket Structure Based Dynamic Stop Loss
Introduction
The Market Structure Based Stop Loss indicator is a strategic tool for traders designed to be useful in both rigorous backtesting and live testing, by providing an objective, “guess-free” stop loss level. This indicator dynamically plots suggested stop loss levels based on market structure, and the concepts of “interim lows/highs.”
It provides a robust framework for managing risk in both long and short positions. By leveraging historical price movements and real time market dynamics, this indicator helps traders identify quantitatively consistent risk levels while optimizing trade returns.
Legend
This indicator utilizes various inputs to customize its functionality, including "Stop Loss Sensitivity" and "Wick Depth," which dictate how closely the stop loss levels hug the price's highs and lows. The stop loss levels are plotted as lines on the trading chart, providing clear visual cues for position management. As seen in the chart below, this indicator dynamically plots stop loss levels for both long and short positions at every point in time.
A “Stop Loss Table” is also included, in order to enhance precision trading and increase backtesting accuracy. It is customizable in both size and positioning.
Case Study
Methodology
The methodology behind this indicator focuses on the precision placement of stop losses using market structure as a guide. It calculates stop losses by identifying the "lowest close" and the corresponding "lowest low" for long setups, and inversely for short setups. By adjusting the sensitivity settings, traders can tweak the indicator's responsiveness to price changes, ensuring that the stop losses are set with a balance between tight risk control and enough room to avoid premature exits due to market noise. The indicator's ability to adapt to different trading styles and time frames makes it an essential tool for traders aiming for efficiency and effectiveness in their risk management strategies.
An important point to make is the fact that the stop loss levels are always placed within the wicks. This is important to avoid what can be described as a “floating stop loss”. A stop loss placed outside of a wick is susceptible to an outsized degree of slippage. This is because traders always cluster their stop losses at high/low wicks, and a stop loss placed outside of this level will inevitably be caught in a low liquidity cascade or “wash-out.” When price approaches a cluster of stop losses, it is highly probable that you will be stopped out anyway, so it is prudent to attempt to be the trader who gets stopped out first in order to avoid high slippage, and losses above what you originally intended.
// For long positions: stop-loss is slightly inside the lowest wick
float dynamic_SL_Long = lowestClose - (lowestClose - lowestLow) * (1 - WickDepth)
// For short positions: stop-loss is slightly inside the highest wick
float dynamic_SL_Short = highestClose + (highestHigh - highestClose) * (1 - WickDepth)
The percentage depth of the wick in which the stop loss is placed is customisable with the “Wick Depth” variable, in order to customize stop loss strategies around the liquidity of the market a trader is executing their orders in.

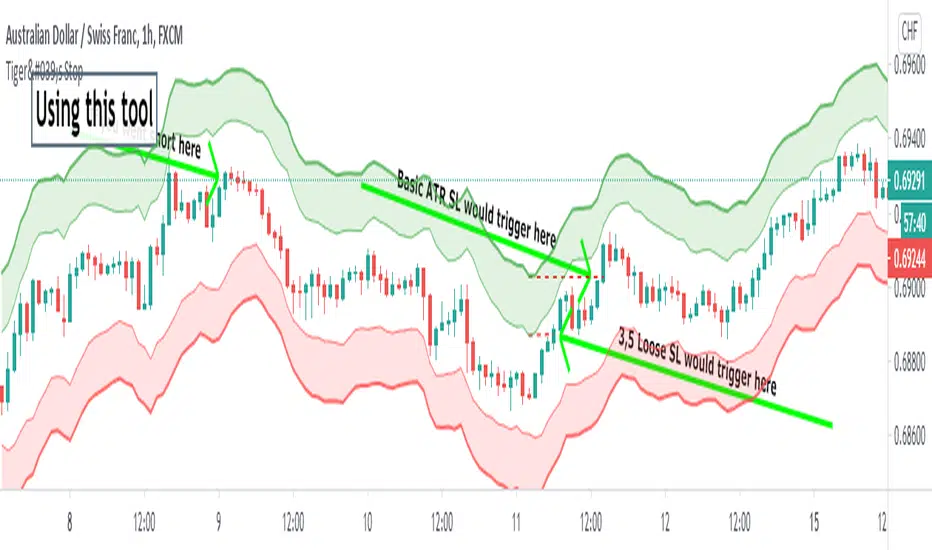
Tiger's Stop - Objective Stoploss SettingTrading is a lot about risk management too. I created this script to help with setting and moving a proper stop-loss. It plots an area that is a result of adding and subtracting both average true range and something I call "false range".
►The Average True Range is calculated as the candle's high-low. If there is a gap, it is added to complete the result.
►My own False Range just candle bodies. It is calculated as an absolute value of (close-open).
Then, Rolling Moving Average is applied on both ATR and False Range to get an idea of how far the price tends to extend out of pure randomness. The resulting value is multiplied by a Multiplier.
The next step is an addition of the values to the higher part of the candle for short or a lower part of the candle for long. I prefer a special calculation instead of using Highs and Lows because it allows for more precise observation and stop-loss set up for less wicky symbols.
►►►Additional Functions
• Smoothing - applies moving average to candles from which range distance is calculated. This can achieve good smoothness but higher values will lead to using outdated price in the SL area calculation.
• Enable/Disable - if you know the direction you are going to trade in, it is good to disable either Long Stop-Loss Area or Short Stop-Loss Area. Just untick it in the settings.
►►►Actual Using
Before using the script to set your stop-loss, check the historical data and find a similar set-up. Is it engulfing you use as a trigger? Find a different one and see how effective the stop-loss based on the ATR*multiplier was. This will help you to optimize Multiplier value. A picture shows such research for a double top. You should find more similar situations to find an optimal value.
Ultimately, the indicator still gives you relatively a lot of freedom with your stop-loss settings (at least, that is with the default settings). You need to decide how loose stop-loss you want to set. Average True Range is the furthermost part which will make for a very large stop-loss, on the other hand, False Range might be triggered by a villainous wick unnecessarily. The choice should depend on the specific symbol you trade and perhaps, you will learn to set stops regardless of the indicator.
A little trick : 1. You can set the loosest stop-loss and set a TradingView alert for where the tightest stop-loss would be. When alerted, you will get the opportunity to reconsider the trade and take a loss if needs be or exit if a candle closes there. 2. Mostly for cryptocurrencies, you can set the tightest stop-loss to protect yourself from sudden spikes. If the price approaches it slowly enough, you can move the stop-loss to the further part of the channel. This is not the same as moving stop-loss indefinitely with hopes of reversal if you plan it from the beginning and a smaller stop is meant to protect you from spikes that are not always predictable and drive to both directions.
►►►Advantages of trailing stop-loss
I usually stick with my original stop-loss instead of moving to break even. If my entry area was functional support once, it may work again and is, therefore, still a good entry zone. But an alternative used to preserve as much of the profit as possible is trailing.
Trailing is setting a specific value in ticks or a calculation of how to move the stop-loss whenever the price moves in your favor. Tiger's Stop can be used this way. Whenever there is a new value as the candle closes and that value is closer to price than your current stop-loss, you can update it. However, if it moves further from your price, don't change the stop-loss. This can be a little tiresome if you do it manually but should be worth the effort.
I usually start trailing only after the price moves significantly in my favor that allowing it to return to the entry price would not make any sense.
►►►Feedback and optimization
The preview chart is chosen entirely at random and the values are not optimized for any specific symbol. If you opt to use it, let me know which values work for you the best, I'll add it to the description when I update it.
Furthermore, let me know if you think any sort of alerts would be useful with my script.
Good luck!
IU Trailing Stop Loss MethodsThe 'IU Trailing Stop Loss Methods' it's a risk management tool which allows users to apply 12 trailing stop-loss (SL) methods for risk management of their trades and gives live alerts when the trailing Stop loss has hit. Below is a detailed explanation of each input and the working of the Script.
Main Inputs:
- bar_time: Specifies the date from which the trade begins and entry price will be the open of the first candle.
- entry_type: Choose between 'Long' or 'Short' positions.
- trailing_method: Select the trailing stop-loss method. Options include ATR, Parabolic SAR, Supertrend, Point/Pip based, Percentage, EMA, Highest/Lowest, Standard Deviation, and multiple target-based methods.
- exit_after_close: If checked, exits the trade only after the candle closes.
Optional Inputs:
ATR Settings:
- atr_Length: Length for the ATR calculation.
- atr_factor: ATR multiplier for SL calculation.
Parabolic SAR Settings:
- start, increment, maximum: Parameters for the Parabolic SAR indicator.
Supertrend Settings:
- supertrend_Length, supertrend_factor: Length and factor for the Supertrend indicator.
Point/Pip Based:
- point_base: Set trailing SL in points/pips.
Percentage Based:
- percentage_base: Set SL as a percentage of entry price.
EMA Settings:
- ema_Length: Length for EMA calculation.
Standard Deviation Settings:
- std_Length, std_factor: Length and factor for standard deviation calculation.
Highest/Lowest Settings:
- highest_lowest_Length: Length for the highest/lowest SL calculation.
Target-Based Inputs:
- ATR, Point, Percentage, and Standard Deviation based target SL settings with customizable lengths and multipliers.
Entry Logic:
- Trades initiate based on the entry_type selected and the specified bar_time.
- If Long is selected, a long trade is initiated when the conditions match, and vice versa for Short.
Trailing Stop-Loss (SL) Methods Explained:
The strategy dynamically adjusts stop-loss based on the chosen method. Each method has its calculation logic:
- ATR: Stop-loss calculated using ATR multiplied by a user-defined factor.
- Parabolic SAR: Uses the Parabolic SAR indicator for trailing stop-loss.
- Supertrend: Utilizes the Supertrend indicator as the stop-loss line.
- Point/Pip Based: Fixed point-based stop-loss.
- Percentage Based: SL set as a percentage of entry price.
- EMA: SL based on the Exponential Moving Average.
- Highest/Lowest: Uses the highest high or lowest low over a specified period.
- Standard Deviation: SL calculated using standard deviation.
Exit Conditions:
- If exit_after_close is enabled, the position will only close after the candle confirms the stop-loss hit.
- If exit_after_close is disabled, the strategy will close the trade immediately when the SL is breached.
Visualization:
The script plots the chosen trailing stop-loss method on the chart for easy visualization.
Target-Based Trailing SL Logic:
- When a position is opened, the strategy calculates the initial stop-loss and progressively adjusts it as the price moves favorably.
- Each SL adjustment is stored in an array for accurate tracking and visualization.
Alerts and Labels:
- When the Entry or trailing stop loss is hit this scripts draws a label and give alert to the user that trailing stop has been hit for the trade.
Note - on the historical data The Script will show nothing if the entry and the exit has happened on the same candle, because we don't know what was hit first SL or TP (basically how the candle was formed on the lower timeframe).
Summary:
This script offers flexible trailing stop-loss options for traders who want dynamic risk management in their strategies. By offering multiple methods like ATR, SAR, Supertrend, and EMA, it caters to various trading styles and risk preferences.

Intraday Stop Loss Calculator[fitfatq]Indicator Overview
Intraday Stop Loss Calculator is a practical tool designed for day traders. This indicator helps traders instantly calculate the loss percentage based on the high or low of the current K-bar relative to the entry price. It also displays the stop-loss risk based on the day's high or low. You can select either long or short mode, allowing the indicator to calculate the appropriate data according to your trading strategy.
Features
Current K-bar Stop Loss: Calculates and displays the loss percentage based on the high or low of the current K-bar, making it ideal for short-term trading decisions. Day Stop Loss: Calculates and displays the loss percentage based on the day's high (for short positions) or low (for long positions), helping you better manage risk by understanding the distance between the current price and key levels.
Adjustable Options
Minute Period: Users can select the minute period for the indicator, with a default of 5 minutes. Position Type: Choose between "Long" or "Short," and the indicator will automatically calculate the relevant stop-loss data based on your selection. Show Day Stop Loss: Users can choose whether to display the stop-loss percentage based on the day's high or low. The default is enabled.
Usage Instructions
Load the indicator, set the minute period, and choose the long or short mode. Depending on your trading strategy, decide whether to display the day's stop-loss percentage. When switching symbols, if the current K-bar has no movement, the indicator may temporarily not display information. This is normal behavior. Please wait for the next K-bar or manually refresh.
Basic Logic
The indicator calculates and displays the loss percentage based on the high or low of the current K-bar and the day's high or low, helping traders understand potential stop-loss risks in real-time. Users can adjust parameters such as color and transparency to ensure the indicator displays clearly and meets their expectations.
Notes
When switching symbols, if the K-bar has no movement, the indicator may not immediately update. This is due to Pine Script requiring data changes to trigger calculations. This indicator is ideal for users who frequently engage in day trading, helping you better manage risk and make timely decisions.
Additionally, please note that in the Chinese version of TradingView, the long/short options might be translated as "Short-term" and "Long-term," but this does not affect the functionality of the indicator.

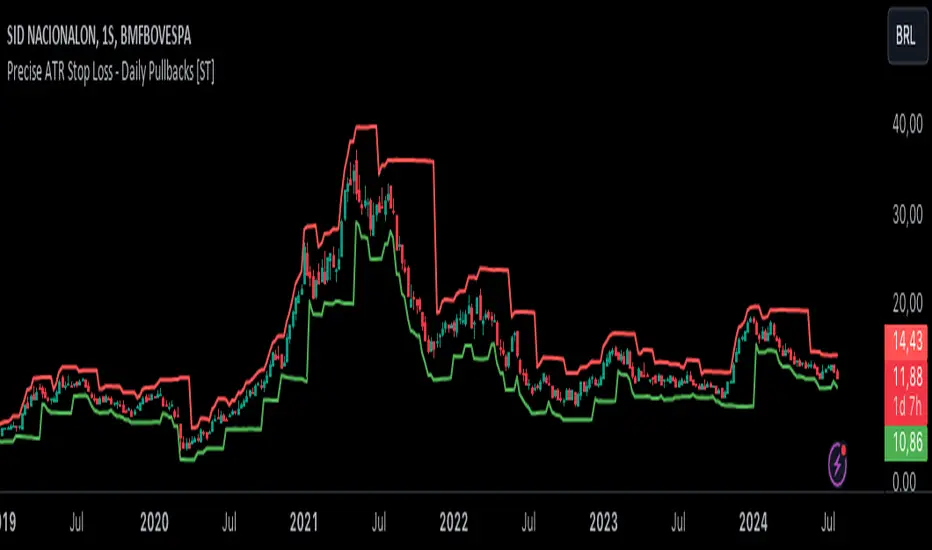
Precise ATR Stop Loss - Daily Pullbacks [ST]Precise ATR Stop Loss - Daily Pullbacks
This indicator uses ATR (Average True Range) combined with the identification of pullback lows and highs on daily charts to calculate more precise stop loss levels.
How it works:
Identification of Pullbacks:
Pullback Lows: Identifies significant low points on daily charts that can serve as support.
Pullback Highs: Identifies significant high points on daily charts that can serve as resistance.
ATR (Average True Range):
Measures market volatility and is used to adjust stop loss levels according to market conditions.
Dynamic Stop Loss:
Stop Loss for Uptrend:
When a pullback low is identified on a daily chart, the stop loss is set slightly below this point, adjusted by the ATR.
This level is shown by a green line on the chart.
Stop Loss for Downtrend:
When a pullback high is identified on a daily chart, the stop loss is set slightly above this point, adjusted by the ATR.
This level is shown by a red line on the chart.
Indicator Benefits:
Improved Precision: Uses significant pullback points on daily charts to set stops more accurately.
Dynamic Stop Loss:
Automatically adjusts stop loss levels according to market volatility, providing more effective risk management.
Título: Precise ATR Stop Loss - Daily Pullbacks
Descrição em Português:
Este indicador utiliza o ATR (Average True Range) combinado com a identificação de fundos e topos de pullback em gráficos diários para calcular níveis de stop loss mais precisos.
Como funciona:
Identificação de Pullbacks:
Fundos de Pullback: Identifica pontos de mínima significativos em gráficos diários que podem servir como suporte.
Topos de Pullback: Identifica pontos de máxima significativos em gráficos diários que podem servir como resistência.
ATR (Average True Range):
Mede a volatilidade do mercado e é utilizado para ajustar os níveis de stop loss de acordo com as condições do mercado.
Stop Loss Dinâmico:
Stop Loss para Tendência de Alta: Quando um fundo de pullback é identificado em um gráfico diário, o stop loss é colocado um pouco abaixo desse ponto, ajustado pelo ATR. Este nível é mostrado por uma linha verde no gráfico.
Stop Loss para Tendência de Baixa: Quando um topo de pullback é identificado em um gráfico diário, o stop loss é colocado um pouco acima desse ponto, ajustado pelo ATR. Este nível é mostrado por uma linha vermelha no gráfico.
Benefícios do Indicador:
Precisão Melhorada: Utiliza pontos de pullback significativos em gráficos diários para posicionar stops de forma mais precisa.
Stop Loss Dinâmico: Ajusta automaticamente os níveis de stop loss de acordo com a volatilidade do mercado, proporcionando uma gestão de risco mais eficaz.
Interactive SAR Stop-Loss [TANHEF]This indicator is "Interactive" which means some inputs can are manually added through the first click after adding the indicator to the chart (SAR Trailing Stop-loss start point).
Unlike the normal Parabolic SAR, this indicator allows for the modification of the start point of the Parabolic SAR’s first bar calculation. Normally, the Parabolic SAR automatically has a start point after the first bar of an asset’s historical price that will then switch between trailing above and below price respectively. It must be noted that due to how the first position of the Parabolic SAR is calculated, on occasion the Parabolic SAR will immediately flip on the next bar to the opposite side relative to price that it was just located. Modifying the setting “⭐Initial Interactive SAR Position Source”, then selecting either 'Clicked' or 'ATR' level as the vertical start position will prevent this. See images below for more explanation.
Why use a trailing stop-loss?
A trailing stop-loss provides an exit when price moves against you but also enables you to move the exit point further into profit when price is moving in the desired direction of a trade. The Parabolic SAR ( stop and reverse ) which is used to determine price direction as well as when price direction is changing, is very effective at functioning as a trailing stop loss.
Indicator Explanation
Initially when this indicator is added to the chart, you will be prompted to select where to begin the SAR Trailing Stop-loss.
For a long stop-loss, select below price.
For a short stop-loss, select above price.
After this indicator is placed, it can be modified via dragging or from within the settings by modifying the time and the price input. Or simply re-add the indicator to the chart. Another option is to have this Parabolic SAR begin directly on the price that was initially ‘Clicked’ or the ‘ATR’ level, which requires selecting the option in settings labeled “⭐Initial Interactive SAR Position Source”
The SAR Stop Loss plotted. Note that the calculation that occurs on this first bar of the ‘Interactive SAR’ is as if the prior bar was the oldest historical bar of the asset. Due to the SAR’s calculations, if the ‘Normal SAR’ were to also flip sides over to the position that has been manually set for the ‘Interactive SAR’, they won’t necessarily have the same result.
An optional fixed profit target can be added within the settings. This profit target will only actively be plotted when the SAR Trailing Stop-loss has not be hit yet or until the profit target has been hit.
Here shows that the profit target was hit, then later on the SAR Trailing Stop-loss was hit.
Note, trailing stop-loss will continue to be plotted until it has been hit regardless of the profit target being hit or not.
Here is an example of when the Parabolic SAR will immediately flip on the next bar to the opposite side relative to price that it was just first located. This is due to how the Parabolic SAR is calculated and will also occur with the traditional Parabolic SAR that is not interactively (manually) given a start location. To prevent this, either relocate this time in which this SAR beings or consider modifying the SAR’s (start, increment, max) settings specifically.
Here instead of using the SAR’s calculation for an initial bar, the ‘ATR’ was selected as the start point within the setting “⭐Initial Interactive SAR Position Source”.
Alerts
1. 'Check' alerts to use within indicator settings (trailing stop hit and/or profit target hit).
2. Select 'Create Alert'
3. Set the condition to 'Interactive SAR''
4. Select create.

Interactive ATR Stop-Loss [TANHEF]This indicator is "Interactive" which means some inputs can are manually added through the first click after adding the indicator to the chart (ATR Trailing Stop-loss start point). See images below for more explanation.
Why use a trailing stop-loss?
A trailing stop-loss provides an exit when price moves against you but also enables you to move the exit point further into profit when price is moving in the desired direction of a trade. The ATR (Average True Range) which is used to measure volatility, is very effective at functioning as a trailing stop loss.
Indicator Explanation
Initially when this indicator is added to the chart, you will be prompted to select where to begin the ATR Trailing Stop-loss.
For a long stop-loss, select below price.
For a short stop-loss, select above price.
After this indicator is placed, it can be modified via dragging or from within the settings by modifying the time and the price input. Or simply re-add the indicator to the chart.
The ATR Stop Loss plotted. Note that the trailing value that is considered as the stop loss value is the value of the ATR from the prior candle. The settings for the ATR calculation can be modified within the settings.
An optional fixed profit target can be added within the settings. This profit target will only actively be plotted when the ATR Trailing Stop-loss has not be hit hit yet or until the profit target has been hit.
Here shows that the profit target was hit, then later on the ATR Trailing Stop-loss was hit.
Note, trailing stop-loss will continue to be plotted until it has been hit regardless of the profit target being hit or not.
Alerts
1. 'Check' alerts to use within indicator settings (trailing stop hit and/or profit target hit).
2. Select 'Create Alert'
3. Set the condition to 'Interactive ATR''
4. Select create.

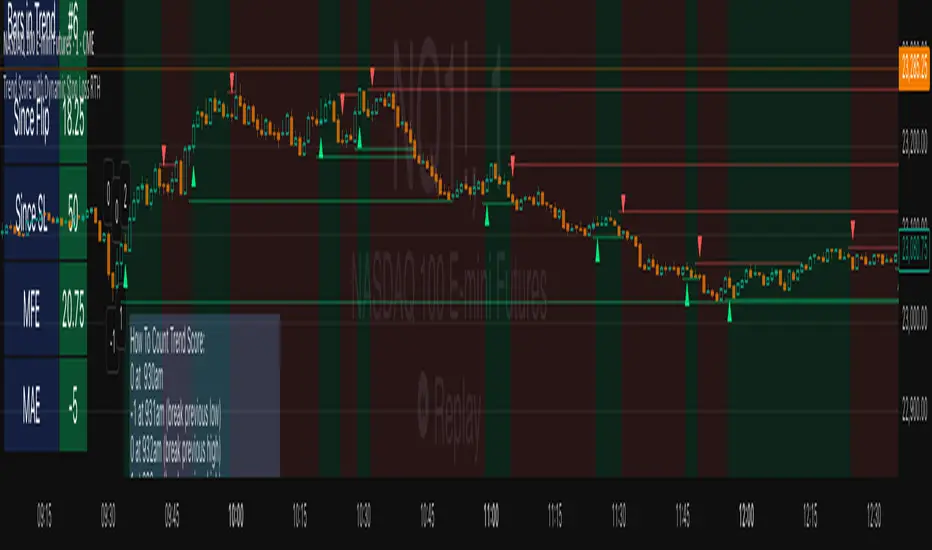
Trend Score with Dynamic Stop Loss RTH
📘 Trend Score with Dynamic Stop Loss (RTH) — Guide
🔎 Overview
This indicator tracks intraday momentum during Regular Trading Hours and flags trend flips using a cumulative TrendScore. It also draws dynamic stop-loss levels and shows a live stats table for quick decision-making and journaling.
⸻
⚙️ Core Concepts
1) TrendScore (per bar)
• +1 if the current bar makes a higher high than the previous bar (counted once per bar).
• –1 if the current bar makes a lower low than the previous bar (counted once per bar).
• If a bar takes both the prior high and low, the net contribution can cancel out within that bar.
2) Cumulative TrendScore (running total)
• The per-bar TrendScore accumulates across the session to form the cumulative TrendScore (TS).
• TS resets to 0 at session open and is cleared at session close.
• Rising TS = persistent upside pressure; falling TS = persistent downside pressure.
⸻
🔄 Flip Rules (3-point reversal of the cumulative TrendScore)
A flip occurs when the cumulative TrendScore reverses by 3 points in the opposite direction of the current trend.
• Bullish Flip
• Trigger: After a decline, the cumulative TrendScore rises by +3 from its down-leg.
• Interpretation: Bulls have taken control.
• Stop-loss: the lowest price of the prior (down) leg.
• Bearish Flip
• Trigger: After a rise, the cumulative TrendScore falls by –3 from its up-leg.
• Interpretation: Bears have taken control.
• Stop-loss: the highest price of the prior (up) leg.
Flip bars are marked with ▲ (lime) for bullish and ▼ (red) for bearish.
Note: If you prefer a different reversal distance, adjust the flip distance setting in the script’s inputs (default is 3).
⸻
📏 Stop-Loss Lines
• A dotted line is drawn at the prior leg’s extreme:
Green (below price) after a bullish flip.
Red (above price) after a bearish flip.
• Options:
Remove on touch for a clean chart.
Freeze on touch to keep a visual record for journaling.
• All stop lines are cleared at session end.
⸻
🧮 Stats Table (what you see)
• Trend: Bull / Bear / Neutral
• Bars in Trend: Count since the flip bar
• Since Flip: Current close minus flip bar close
• Since SL: Current close minus active stop level
• MFE-Maximum Favorable Excursion: Highest favorable move since flip
• MAE-Maximum Adverse Excursion: Largest adverse move since flip
Table colors reflect the current trend (green for bull, red for bear).
⸻
📊 Trading Playbook
Entries
• Aggressive: Enter immediately on a flip marker.
• Conservative: Wait for a small pullback that doesn’t violate the stop.
Stops
• Place the stop at the script’s flip stop-loss line (the prior leg extreme).
Exits
Choose one style and stick with it:
• Stop-only: Exit when the stop is hit.
• Time-based: Flatten at session close.
• Targets: Scale/close at 1R, 2R.
• Trailing: Trail behind minor swings once MFE > 1R.
Ultimately Exit choice is your own edge, so you must decide for yourself.
💡 Best Practices
• Skip the first few bars after the open (gap noise).
• Use regular candles (Heikin-Ashi will distort highs/lows).
• If you want fewer flips, increase the flip distance (e.g., 4 or 5). For more
responsiveness, use 2. Otherwise, increase your time frame to 5m, 10m, 15m.
• Keep SL lines frozen (not auto-removed) if you’re journaling.
Trailing Stop Loss Smart [TradingFinder] Market Trend + CVD/EMA🔵 Introduction
Trailing Stop Loss (TSL) is one of the most powerful tools available. A Trailing Stop Loss is a modification of a typical stop order that adjusts dynamically based on market price movement. It can be set at a defined percentage or dollar amount away from the security's current market price, making it a flexible tool for locking in profits while minimizing risk. Unlike standard stop-loss orders, a Trailing Stop follows the market in the direction of the trade, protecting gains without requiring constant manual adjustments.
The Trailing Stop Loss Smart (TFlab Trailing Stop) indicator takes this concept even further by incorporating advanced metrics like Cumulative Volume Delta (CVD), volume dynamics, and Average True Range (ATR). This combination not only enhances risk management but also acts as a trend identifier, providing traders with a powerful tool to capitalize on both short-term and long-term price movements.
This indicator also supports various Order Types, allowing for flexible strategies that include a trailing stop/stop-loss combo to maximize winning trades while minimizing losses. The trailing stop limit is particularly useful for traders who want to set their stop at a precise level relative to the current market price, either by a percentage or a dollar amount. The Trailing Stop Loss Smart indicator can help ensure that traders do not exit too early during trends, while the stop-loss feature kicks in during reversals.
The advantages of using a Trailing Stop Loss are its ability to protect profits and reduce the emotional decision-making process in volatile markets. However, like all trading strategies, it has disadvantages, such as the risk of triggering too early during normal market fluctuations. By understanding how the Trailing Stop Loss Smart indicator integrates features like CVD, ATR, and volume analysis, traders can leverage its full potential while navigating these pros and cons.
With its unique ability to track market movements and trends using Cumulative Volume Delta, volume dynamics, and ATR-based trailing stops, this indicator offers a complete solution for traders looking to secure profits while minimizing downside risk. Whether you're employing a simple trailing stop or a trailing stop/stop-loss combo, this tool provides all the flexibility and precision needed to execute winning trades in various markets, including Forex, Crypto, and Stock.
🔵 How to Use
The Trailing Stop Loss Smart indicator integrates multiple advanced components to provide traders with superior risk management and trend identification.
Here’s how each part of the logic works :
🟣 Cumulative Volume Delta (CVD) Logic
The CVD tracks buying and selling pressure by calculating the difference between upward and downward price movements. When there’s more buying pressure, the CVD is positive, indicating a potential bullish trend. Conversely, more selling pressure results in a negative CVD, pointing to a bearish trend.
CVD Trend Detection : The indicator determines whether the market is in a bullish or bearish phase by comparing the CVD to its moving average. A bullish trend is confirmed when the CVD is above its moving average and the price is closing higher.
A bearish trend occurs when the CVD is below its moving average and the price is closing lower. This trend detection is critical for determining whether the trailing stop should be placed below the price (bullish) or above it (bearish).
🟣 Volume Dynamics
Volume is a key factor in identifying market strength. The Trailing Stop Loss Smart indicator pulls volume data based on the market selected (Forex, Crypto, or Stock) and adjusts the trailing stop based on whether the market is experiencing high volume or low volume.
High Volume : When the current volume exceeds the average volume, the market is in a high-volume state. During these conditions, the trailing stop is placed closer to the price, as high volume often indicates strong trends with less chance of reversals.
Low Volume : In low-volume conditions, the trailing stop gives the market more room to breathe by placing the stop further away from the price. This prevents premature stop-outs in periods of reduced market activity.
🟣 ATR-Based Trailing Stop
The Average True Range (ATR) is used to measure market volatility. The Trailing Stop Loss Smart uses the ATR to dynamically adjust the stop-loss distance.
Bullish Market : When a bullish trend is detected, the trailing stop is placed below the lowest price of the recent bars (determined by the Bar Back parameter), and adjusted by the ATR Multiplier. This allows for tighter protection during strong bullish trends.
Bearish Market : When the market is bearish, the trailing stop is placed above the highest price of recent bars, also adjusted by the ATR Multiplier. This ensures that short positions are safeguarded against sudden reversals.
🟣 Dynamic Stop-Loss Updates
The trailing stop is updated every few bars (according to the Refiner parameter), ensuring it remains relevant to the most recent price action and volume changes. This dynamic feature ensures the stop-loss adapts to both trending and volatile market conditions, without requiring manual intervention.
High Volume with Trends : In periods of high volume and a confirmed trend, the stop-loss is positioned tightly to lock in profits while minimizing the risk of reversal.
Low Volume with Trends : In low-volume conditions, the stop-loss is placed further from the price, allowing the market to move freely without triggering premature exits.
🟣 Visual Representation
The indicator visually represents the trailing stop on the chart, with green lines indicating bullish trends and red lines for bearish trends. This visual aid helps traders quickly assess the state of the market and the position of their trailing stop in real-time.
🔵 Settings
The Trailing Stop Loss Smart indicator offers several customizable settings to suit various trading strategies. Understanding these inputs is key to optimizing the tool for your specific trading style.
🟣 General Settings
Cumulative Mode : This controls how the CVD is calculated.
You can choose between :
EMA : Exponential Moving Average smoothing.
Periodic : Sums the delta over a fixed period.
CVD Period : Defines the look-back period for CVD calculation. A longer period smooths the data, making it less sensitive to short-term fluctuations.
Ultra Data : This Boolean input aggregates volume across multiple exchanges for a more comprehensive view of market activity.
Market Ultra Data : Select between Forex, Crypto, and Stock to ensure the indicator pulls accurate volume data for your market.
🟣 Logical Settings
Moving Average CVD Period : Defines the period for the moving average of the CVD. A longer period smooths the trend, reducing noise.
Moving Average Volume Period : Sets the period for the moving average used to distinguish between high and low volume conditions.
Level Finder Bar Back : Determines how many bars to look back when identifying the highest or lowest price for trailing stop placement.
Levels update per candles : Sets how often (in bars) the trailing stop should be updated to remain in sync with market movements.
ATR On : Toggles the use of ATR to adjust the trailing stop based on volatility.
ATR Multiplie r: Defines how far the stop is placed from the price based on the ATR. A larger multiplier increases the stop distance, reducing the likelihood of getting stopped out during market fluctuations.
ATR Multiplier Adjusts the distance of the trailing stop based on the ATR. A higher multiplier places the stop further from the price, providing more breathing room in volatile markets.
🔵 Conclusion
The Trailing Stop Loss Smart indicator is a comprehensive tool for traders looking to manage risk while identifying market trends. By incorporating Cumulative Volume Delta (CVD) to detect buying and selling pressure, volume dynamics to gauge market activity, and ATR to adjust for volatility, this indicator ensures that stop-loss levels are both adaptive and protective.
Whether you’re trading in Forex, Crypto, or Stock markets, the Trailing Stop Loss Smart allows you to capitalize on trends while dynamically adjusting to changing market conditions. Its ability to distinguish between high-volume and low-volume periods ensures that you’re not stopped out prematurely during periods of consolidation or market hesitation.
By providing real-time visual feedback, dynamic adjustments, and trend identification, this indicator serves as a vital tool for traders aiming to maximize profits while minimizing risk. Its versatility and adaptability make it an essential part of any trader’s toolkit, helping you stay ahead in fast-moving markets while safeguarding your positions.

Trailing Stop Loss SuperTrendThe Trailing Stop Loss SuperTrend indicator is a popular technical analysis tool used by traders to identify trends and determine optimal entry and exit points in financial markets. This indicator combines elements of the SuperTrend indicator and trailing stop loss orders to provide valuable insights into market trends and potential reversals. By incorporating Average True Range (ATR) calculations, it adapts to market volatility, making it suitable for various trading strategies. Let's explore the key use cases and benefits of the Trailing Stop Loss SuperTrend indicator:
Trend Identification:
The primary purpose of the Trailing Stop Loss SuperTrend indicator is to identify market trends. It plots two lines on the chart: an upper band (referred to as the "up" line) and a lower band (referred to as the "dn" line). The direction of these bands helps traders determine the prevailing trend. When the price is above the upper band, it suggests a bullish trend, and when it is below the lower band, it indicates a bearish trend.
Entry and Exit Signals:
The Trailing Stop Loss SuperTrend indicator generates entry and exit signals based on trend changes. When the trend changes from bearish to bullish, a buy signal is triggered, indicating a potential entry point. Conversely, when the trend changes from bullish to bearish, a sell signal is generated, suggesting a possible exit or short-selling opportunity. These signals can be used in conjunction with other trading strategies or indicators to enhance trading decisions.
Trailing Stop Loss Orders:
One of the distinguishing features of the Trailing Stop Loss SuperTrend indicator is its ability to incorporate trailing stop loss orders. Traders can use the indicator's upper and lower bands as trailing stop levels to protect profits and manage risk. For example, in a bullish trend, the stop loss level can be set at the lower band, and as the price rises, the stop loss level trails along with it, locking in profits and reducing potential losses.
Volatility Adaptation:
By incorporating the ATR (Average True Range) calculation, the Trailing Stop Loss SuperTrend indicator adjusts its sensitivity to market volatility. A higher ATR multiplier widens the distance between the price and the bands, accommodating higher volatility, while a lower multiplier tightens the bands during periods of lower volatility. This adaptability makes the indicator versatile and suitable for various market conditions.
Alerts and Notifications:
The Trailing Stop Loss SuperTrend indicator provides the ability to set alerts for specific events, such as trend changes, buy signals, and sell signals. Traders can receive real-time notifications via email, SMS, or on-platform alerts, ensuring they stay informed about potential trading opportunities and important market developments.
Conclusion:
The Trailing Stop Loss SuperTrend indicator is a valuable tool for traders seeking to identify trends, generate entry and exit signals, and effectively manage risk. Its ability to adapt to market volatility and incorporate trailing stop loss orders enhances trading strategies and decision-making. By combining the SuperTrend concept with trailing stop loss functionality, this indicator provides traders with a comprehensive approach to trend analysis and risk management. Whether used in isolation or in conjunction with other indicators, the Trailing Stop Loss SuperTrend indicator offers a powerful tool for navigating the dynamic world of financial markets.

CUT MY LOSSESS - Levereged Stop loss + R / R ratio checker Hello traders!
We have heard many times that keep your losses small and allow your profits to grow. But what happens is that we often make the mistake of doing high-margin trades that we cannot afford to lose. The main reason for this problem, in my opinion, is the rush to open a position and not paying attention to how much acceptable loss in each trade is for us? Is our stop loss point compatible with the loss we are willing to accept?
Many of the losses we incur are not due to our erroneous analysis but to the wrong trading strategy, miscalculation of Stop Loss and failure to calculate the Risk/Reward for each trade. At least for most novice traders, these mistakes happen .
This script does not have complicated logic and is designed only as a help for those who are not interested in working with calculators !! I hope that sometimes that we are very excited to buy, looking at this script can give us a serious flip to avoid risk .
This is a basic script that helps us to intuitively check our stop loss in according to our leverage and to guess the approximate risk/reward of our trade. This script assumes that you always trade with half of your total capital. It is also assumed that you routinely use up to ten percent of your capital for each trade. Therefore, the first variable in this script is the amount of tolerable loss in each trade for you, which is set to 25% by default. So if you follow the previous assumptions, each trade will endanger 2.5% of your capital.
Since not all analyzes are ever accurate, we need to enter into positions that have good Risk/Reward ratio, so that even if half of our analysis fails, we will profitable. Therefore, the second variable in this script is the acceptable Risk/Reward ratio for us, which is set to 1:4 by default.
Also, to check the efficiency of the stop-loss with different trading leverage, I add five leverage by default from 1 to 5 as lines on the side of your stop-loss point.
LeV A (Lowest Leverage-WHITE): 1 by default
LeV B (AQUA): 2 by default
LeV C (YELLOW): 3 by default
LeV D (ORANGE): 4 by default
LeV E (Highest Leverage-RED):5 by default
You can change all these leverages and Acceptable margin loss and R/R ratio according to your needs.
You can also hide the leverage lines you are not dealing with through the script settings .
You will also see lines on the side of your target point to check your risk/reward ,so you can approximate your target according to your trading leverage and the risk/reward you accept. you can also hide these R/R lines from the setting.
Important Note: This script is not designed to give you a stop loss point or take profit point.
To find these points, you must use technical analysis methods , and then use this script to check the coordination of these points with your trading strategy.
Using the script is simple, but I will try to explain it with a few examples.

Position Size Using Manual Stop Loss [odnac]
This indicator calculates the risk per position based on user-defined settings.
Two Calculation Methods
1. Manual Stop Loss (%) & Manual Leverage
2. Manual Stop Loss (%) & Optimized Leverage
Settings
1. init_capital
Enter your current total capital.
2. Maximum Risk (%) per Position of Total Capital
Specify the percentage of your total funds to be risked for a single position.
3. manual_SL(%)
Enter the stop-loss percentage.
Range: 0.01 ~ 100
4. manual_leverage
Enter the leverage you wish to use.
Range: 1 ~ 100
Used in the first method (Manual Stop Loss (%) & Manual Leverage).
5. Safety Margin
Specify the safety margin for optimized leverage.
Range: 0.01 ~ 1
Used in the second method (Manual Stop Loss (%) & Optimized Leverage). Details are explained below.
Indicator Colors
Black: Indicates which method is being used.
White: Leverage.
First Green: Funds to be invested.
Second Green: Funds to be invested * Leverage.
First Red: Stop-loss (%).
Second Red: Stop-loss (%) * Leverage.
Details for Each Method:
1. Manual Stop Loss (%) & Manual Leverage
This method calculates the size of the funds based on user-defined stop-loss (%) and leverage settings.
White: manual_leverage.
First Green: Investment = Maximum Risk / (manual_SL / 100) / manual_leverage
Second Green: Maximum Risk * (manual_SL / 100)
First Red: manual_SL.
Second Red: manual_SL * manual_leverage
Ensure that the product of manual_SL and manual_leverage does not exceed 100.
If it does, there is a risk of liquidation.
2. Manual Stop Loss (%) & Optimized Leverage
This method calculates optimized leverage based on the user-defined stop-loss (%) and determines the size of the funds.
Optimization_LEVER = auto_leverage * safety_margin
auto_leverage = 100 / stop-loss (%), rounded down to the nearest whole number.
(Exception: If the stop-loss (%) is in the range of 0 ~ 1%, auto_leverage is always 100.)
Example:
If the stop-loss is 4%, auto_leverage = 25 (100 / 4 = 25).
However, 4% × 25 leverage equals 100%, meaning liquidation occurs even with a stop-loss.
To reduce this risk, the safety_margin value is applied.
White: auto_leverage * safety_margin
First Green: Investment = Maximum Risk / (manual_SL / 100) / optimization_LEVER
Second Green: Maximum Risk * (manual_SL / 100)
First Red: manual_SL.
Second Red: manual_SL * optimization_LEVER